Multiple Choice
Figure 5-12 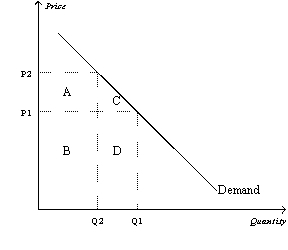
-Refer to Figure 5-12. Total revenue when the price is P1 is represented by the area(s)
A) B + D.
B) A + B.
C) C + D.
D) D.
Correct Answer:
Verified
Related Questions
Q198: Income elasticity of demand measures how
A)the quantity
Q243: Table 5-5
The following table shows a portion
Q244: Table 5-5
The following table shows a portion
Q248: The income elasticity of demand for caviar

