Figure 13-3. The figure shows two demand-for-loanable-funds curves and two supply-of-loanable-funds curves. 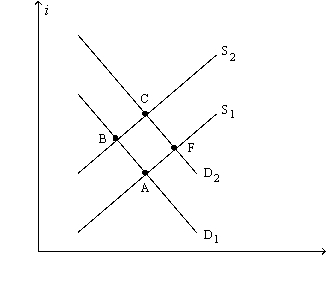
-Refer to Figure 13-3. A shift of the supply curve from S1 to S2 is called
A) an increase in the supply of loanable funds.
B) an increase in the quantity of loanable funds supplied.
C) a decrease in the supply of loanable funds.
D) a decrease in the quantity of loanable funds supplied.
Correct Answer:
Verified
Q94: If the government instituted an investment tax
Q114: Which of the following are effects of
Q138: The slope of the supply of loanable
Q140: As real interest rates fall,firms desire to
A)buy
Q207: Suppose the government changed the tax laws,
Q374: Figure 13-3. The figure shows two demand-for-loanable-funds
Q375: Figure 13-1. The figure depicts a demand-for-loanable-funds
Q377: Figure 13-2. The figure depicts a supply-of-loanable-funds
Q381: Other things the same, an increase in
Q385: If the budget deficit increases then
A) saving
Unlock this Answer For Free Now!
View this answer and more for free by performing one of the following actions

Scan the QR code to install the App and get 2 free unlocks

Unlock quizzes for free by uploading documents