Figure 9.7 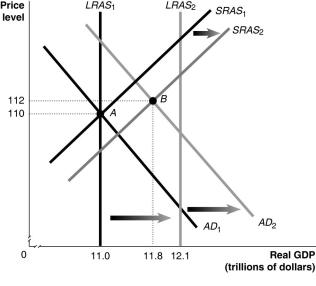 Alt text for Figure 9.7: In figure 9.7, a graph comparing real GDP and price level.
Long description for Figure 9.7: The x-axis is labelled, real GDP (trillions of dollars) , with values 11.0, 11.8, 12.1 marked.The y-axis is labelled, price level, with values 110 and 112 marked.6 lines are shown; SRAS1, SRAS2, AD1, AD2, LRAS1, LRAS2.Line SRAS1 begins near the bottom left and slopes up to the top right corner.Line SRAS2 follows the same slope as line SRAS1, but is plotted to the right.The area between lines SRAS1 and SRAS2 is indicated by a right pointing arrow.Line AD1 begins at the top left corner and slopes down toward the bottom center.Line AD2 follows the same slope as AD1, but is plotted to the right.The area between lines AD1 and AD2 is indicated by a right pointing arrow.Line LRAS1 is perpendicular to the x-axis, and begins from value 11.0.Line LRAS2 perpendicular to the x-axis, and begins from point 12.1.The area between lines LRAS1 and LRAS2 is indicated by a right pointing arrow.Line LRAS1 intersects lines AD1 and SRAS1 at point A (11.0, 110) .Lines AD2 and SRAS2 intersect at point B (11.8, 112) .Points A and B are connected to their respective coordinates on the x-axis and y-axis with dotted lines.Line LRAS2 intersects lines SRAS1 and SRAS2 on the right end of these lines.Similarly, line LRAS2 intersects lines AD1 and AD2 on the right end of these lines.
-Refer to Figure 9.7.In the figure above, LRAS1 and SRAS1 denote LRAS and SRAS in year 1, while LRAS2 and SRAS2 denote LRAS and SRAS in year 2.Given the economy is at point A in year 1, what is the growth rate in potential GDP in year 2?
A) 2%
B) 8%
C) 9.1%
D) 10%
E) 12%
Correct Answer:
Verified
Q213: An increase in government spending will result
Q213: Stagflation is often a result of
A)a negative
Q214: When people became less concerned with the
Q215: Which of the following is one reason
Q219: In the dynamic aggregated demand and aggregate
Q220: Which of the following could explain why
Q222: One factor which brought on the recession
Q223: During 2008-2009, falling oil prices
A)shifted the Canadian
Q240: What is a supply shock,and why might
Q251: In the dynamic aggregate demand and aggregate
Unlock this Answer For Free Now!
View this answer and more for free by performing one of the following actions

Scan the QR code to install the App and get 2 free unlocks

Unlock quizzes for free by uploading documents