Figure 9.7 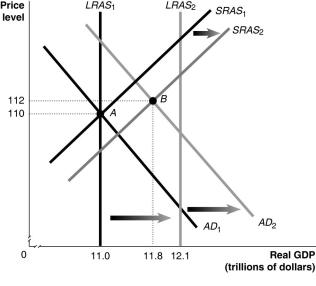 Alt text for Figure 9.7: In figure 9.7, a graph comparing real GDP and price level.
Long description for Figure 9.7: The x-axis is labelled, real GDP (trillions of dollars) , with values 11.0, 11.8, 12.1 marked.The y-axis is labelled, price level, with values 110 and 112 marked.6 lines are shown; SRAS1, SRAS2, AD1, AD2, LRAS1, LRAS2.Line SRAS1 begins near the bottom left and slopes up to the top right corner.Line SRAS2 follows the same slope as line SRAS1, but is plotted to the right.The area between lines SRAS1 and SRAS2 is indicated by a right pointing arrow.Line AD1 begins at the top left corner and slopes down toward the bottom center.Line AD2 follows the same slope as AD1, but is plotted to the right.The area between lines AD1 and AD2 is indicated by a right pointing arrow.Line LRAS1 is perpendicular to the x-axis, and begins from value 11.0.Line LRAS2 perpendicular to the x-axis, and begins from point 12.1.The area between lines LRAS1 and LRAS2 is indicated by a right pointing arrow.Line LRAS1 intersects lines AD1 and SRAS1 at point A (11.0, 110) .Lines AD2 and SRAS2 intersect at point B (11.8, 112) .Points A and B are connected to their respective coordinates on the x-axis and y-axis with dotted lines.Line LRAS2 intersects lines SRAS1 and SRAS2 on the right end of these lines.Similarly, line LRAS2 intersects lines AD1 and AD2 on the right end of these lines.
-Refer to Figure 9.7.Given the economy is at point A in year 1, what is the inflation rate between year 1 and year 2?
A) 0.9%
B) 1.8%
C) 2.7%
D) 3.0%
E) 10%
Correct Answer:
Verified
Q197: Figure 9.6 Q198: After an unexpected increase in the price Q199: Why does the short-run aggregate supply curve Q200: If rapid increases in oil prices caused Q201: Stagflation occurs when inflation _ and GDP Q202: At a long-run macroeconomic equilibrium,real GDP is Q205: Many economists believe that increases in government Q206: Using aggregate demand and aggregate supply, explain Q227: Starting from long-run equilibrium,use the basic aggregate Q236: Why are the long-run effects of an![]()
Unlock this Answer For Free Now!
View this answer and more for free by performing one of the following actions

Scan the QR code to install the App and get 2 free unlocks

Unlock quizzes for free by uploading documents