Figure 13.4 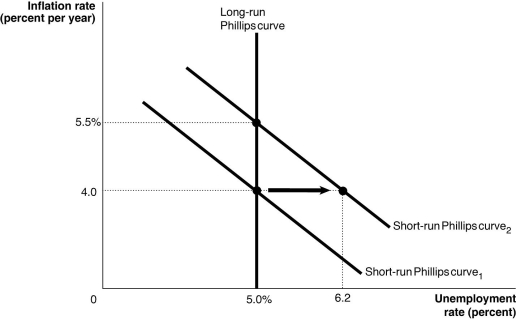 Alt text for Figure 13.4: In figure 13.4, a graph shows the shift in the short-run Phillips curve.
Long description for Figure 13.4: The x-axis is labelled, unemployment rate percent.The y-axis is labelled, inflation rate percent per year.A straight line labelled, short-run Philips Curve 1, begins at the top left corner and slopes down to the end of the x-axis.A straight line labelled, short-run Philips Curve 2, follows the same slope as curve 1, but is plotted to the right.The area between Curve 1 and Curve 2 is indicated by a right pointing arrow.A straight line labelled, long-run Philips Curve 1 is perpendicular to the x-axis, and begins from the x-axis value 5.0%.Long-run Philips Curve 1 intersects the short-run Philips Curve 1 at point (5.0%, 4.0) and intersects the short-run Philips Curve 2 at point (5.0%, 5.5%) .Point (6.2, 4.0) is plotted toward the right end of the short-run Philips Curve 2.The points are connected to their respective coordinates on the x-axis and y-axis with dotted lines.
-Refer to Figure 13.4.Consider the shift in the short-run Phillips curve shown in the above graph. This shift may be explained by
A) an increase in the natural rate of unemployment from 5.0 to 6.2 percent.
B) an increase in the expected rate of inflation from 4.0 to 5.5 percent.
C) either an increase in the natural rate of unemployment from 5.0 to 6.2 percent or an increase in the expected rate of inflation from 4.0 to 5.5 percent.
D) a decrease in the natural rate of unemployment.
E) none of the above.
Correct Answer:
Verified
Q116: An increase in the expected inflation rate
Q117: In the long run, the Phillips curve
Q120: What actions could the Bank of Canada
Q122: The short-run Phillips curve is _ than
Q123: If expected inflation falls, the long-run Phillips
Q125: The short-run Phillips curve will not shift
Q126: When unemployment is above its natural rate,
Q128: The natural rate of unemployment is fixed
Q130: An increase in expected inflation will shift
Q139: What is the relationship between the short-run
Unlock this Answer For Free Now!
View this answer and more for free by performing one of the following actions

Scan the QR code to install the App and get 2 free unlocks

Unlock quizzes for free by uploading documents