Figure 13.6 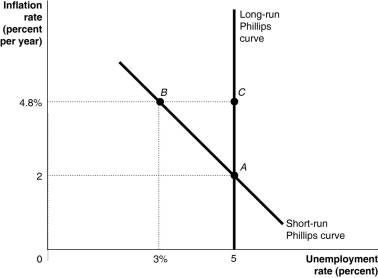 Alt text for Figure 13.6: In figure 13.6, a graph shows the short-run and long-run Phillips curves.
Long description for Figure 13.6: The x-axis is labelled, unemployment rate percent.The y-axis is labelled, inflation rate percent per year.A straight line labelled, short-run Philips Curve, begins at the top left corner and slopes down to the end of the x-axis.A straight line labelled, long-run Philips Curve is perpendicular to the x-axis, and begins from the x-axis value 5.Long-run Philips Curve intersects the short-run Philips Curve at point A (5, 2) , near the bottom of the line and passes through point C (5, 4.8%) near the top end.Point B (3%, 4.8%) is plotted near the left end of the short-run Philips Curve, with the same y-axis value as point C.The points are connected to their respective coordinates on the x and y-axes with dotted lines.
-Refer to Figure 13.6.If firms and workers have adaptive expectations, an expansionary monetary policy will cause the short-run equilibrium to move from
A) point B to point C.
B) point A to point C.
C) point A to point B.
D) point B to point A.
E) point C to point B.
Correct Answer:
Verified
Q138: Use the following information to draw a
Q155: Lucas and Sargent argue that the short-run
Q156: If firms and workers have rational expectations,
Q157: Some economists argue that the short-run Phillips
Q159: Which of the following would be the
Q162: The actual real wage is lower than
Q163: According to economists Robert Lucas and Thomas
Q182: Empirical evidence shows that the short-run Phillips
Q192: Use the information below to explain adjustments
Q216: If expectations are adaptive,how will the economy
Unlock this Answer For Free Now!
View this answer and more for free by performing one of the following actions

Scan the QR code to install the App and get 2 free unlocks

Unlock quizzes for free by uploading documents