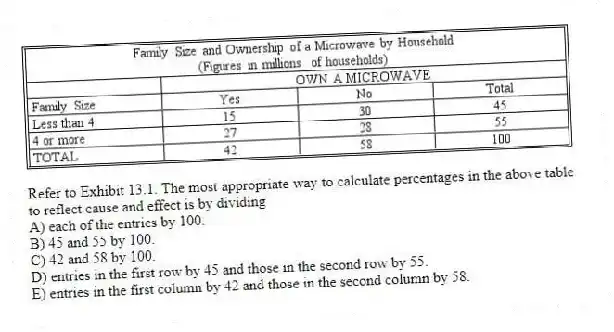

-Refer to Exhibit 13.1. The most appropriate way to calculate percentages in the above table to reflect cause and effect is by dividing
A) each of the entries by 100.
B) 45 and 55 by 100.
C) 42 and 58 by 100.
D) entries in the first row by 45 and those in the second row by 55.
E) entries in the first column by 42 and those in the second column by 58.
Correct Answer:
Verified
Q14: Q14: Which of the following is a technique Q15: What conclusion(s) can you make from the Q16: Which of the following statements about regression/correlation Q18: An analyst has a set of normally Q21: Suppose the ordinary least-squares approach to a Q29: The upper limit of the Pearson chi-square Q38: Cramer's V is scaled to range between Q59: If an organization selects two towns for Q60: Suppose you were given an example of![]()
A)0.0
Unlock this Answer For Free Now!
View this answer and more for free by performing one of the following actions

Scan the QR code to install the App and get 2 free unlocks

Unlock quizzes for free by uploading documents