Multiple Choice
Figure 5-13 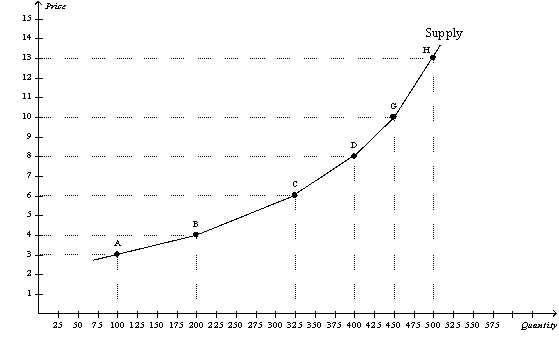
-Refer to Figure 5-13.Using the midpoint method,what is the price elasticity of supply between points B and C?
A) 1.67
B) 1.19
C) 0.84
D) 0.61
Correct Answer:
Verified
Related Questions
Q56: On a certain supply curve,one point is
Q345: Figure 5-13 Q346: Table 5-6 Q347: Figure 5-13 Q348: Figure 5-12 Q349: At a price of $1.20,a local coffee Q351: At a price of $1.00,a local coffee Unlock this Answer For Free Now! View this answer and more for free by performing one of the following actions Scan the QR code to install the App and get 2 free unlocks Unlock quizzes for free by uploading documents![]()
![]()
![]()
The following figure shows the supply

