Figure 21-3
In each case,the budget constraint moves from BC-1 to BC-2. 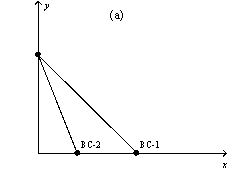
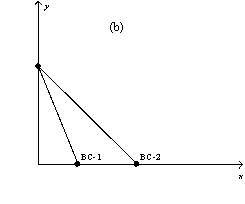
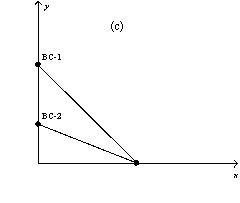
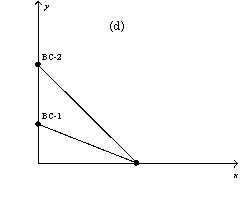
-Refer to Figure 21-3.Which of the graphs in the figure could reflect a decrease in the prices of both goods?
A) graph a
B) graph b
C) graph c
D) None of the above is correct.
Correct Answer:
Verified
Q92: Figure 21-4 Q93: Figure 21-4 Q94: The following diagram shows a budget constraint Q98: Suppose a consumer spends her income on Q99: The slope of the budget constraint is Q101: The following diagram shows a budget constraint Q131: Suppose a consumer is currently spending all Q135: A consumer is currently spending all of Q412: Figure 21-3 Q469: Suppose a consumer spends her income on![]()
![]()
In each case, the budget constraint
Unlock this Answer For Free Now!
View this answer and more for free by performing one of the following actions

Scan the QR code to install the App and get 2 free unlocks

Unlock quizzes for free by uploading documents