Multiple Choice
Figure 13.1 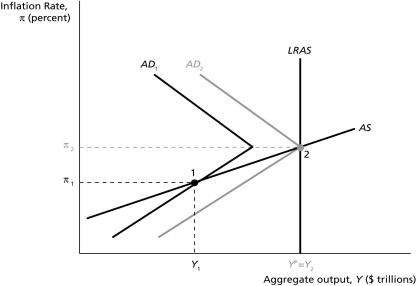
-In Figure 13.1,"the zero lower bound" is displayed at ________.
A) point 1
B) point 2
C) 
D) the origin (intersection of the axes)
E) none of the above
Correct Answer:
Verified
Related Questions
Q90: Figure 13.1 Q91: The key difference between "quantitative easing" and Q92: After 1975,the U.S.economy continued to experience high Q93: When the credit spread rises,an effective policy![]()
Unlock this Answer For Free Now!
View this answer and more for free by performing one of the following actions

Scan the QR code to install the App and get 2 free unlocks

Unlock quizzes for free by uploading documents