Figure 4-3 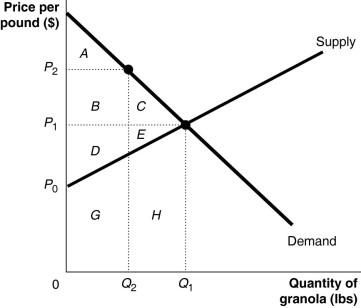 Figure 4-3 shows the market for granola.The market is initially in equilibrium at a price of P1 and a quantity of Q1.Now suppose producers decide to cut output to Q2 in order to raise the price to P2.
-Refer to Figure 4-3.What area represents producer surplus at the equilibrium price of P1?
A) A + B + D
B) D + E
C) D + E + G + H
D) A + B + C + D + E
Correct Answer:
Verified
Q68: The market price for coffee is $2.25
Q69: Figure 4-3 Q70: Figure 4-3 Q71: Assume the market price for tangerines is Q72: What is marginal cost? Which curve is Q74: The additional benefit to a consumer from Q75: When the marginal benefit equals the marginal Q76: The additional cost to a firm of Q77: Figure 4-3 Q78: Figure 4-3 Unlock this Answer For Free Now! View this answer and more for free by performing one of the following actions Scan the QR code to install the App and get 2 free unlocks Unlock quizzes for free by uploading documents![]()
![]()
![]()
![]()

