In the figure below, a rise in income will (ceteris paribus) shift utility-maximizing consumption from E to: 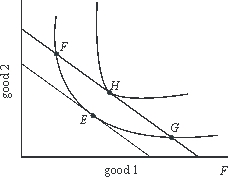
A) F
B) G
C) H
D) I
E) no shift will occur.
Correct Answer:
Verified
Q3: An indifference curve represents consumption bundles among
Q4: When MUl/Pl = MU2/P2, the indifference curve
Q5: A consumer's indifference curves will be influenced
Q6: The slope of an indifference curve is:
A)the
Q7: What is the straight line that sums
Q9: Increasing all prices and income in exactly
Q10: In the figure below, if the consumer
Q11: A purpose of indifference-curve analysis is to:
A)derive
Q12: The equilibrium condition for the consumer is
Q13: In the figure below, a shift in
Unlock this Answer For Free Now!
View this answer and more for free by performing one of the following actions

Scan the QR code to install the App and get 2 free unlocks

Unlock quizzes for free by uploading documents