Refer to Figure 6.4.What area represents the decrease in consumer surplus when the price of computers increases from $1,000 to $1,500? 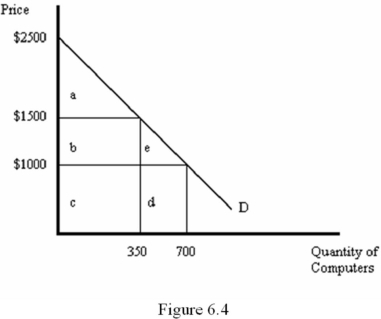
A) b
B) b + e
C) b + c
D) a + b
Correct Answer:
Verified
Q9: Refer to Figure 6.4.If the price of
Q10: Which of the following does NOT occur
Q11: The amount of compensation associated with the
Q12: Suppose Eddie's demand curve for text messages
Q13: Refer to Figure 6.3.Suppose the price of
Q15: Refer to Figure 6.1.Assume that L1 represents
Q16: Refer to Figure 6.1.Assume that L1 represents
Q17: Refer to Figure 6.4.If the price of
Q18: Refer to Figure 6.4.If the price of
Q19: Refer to Figure 6.1.Assume that L1 represents
Unlock this Answer For Free Now!
View this answer and more for free by performing one of the following actions

Scan the QR code to install the App and get 2 free unlocks

Unlock quizzes for free by uploading documents