Figure 6.2 illustrates a change in the price of soup.From the graph,we can conclude that: 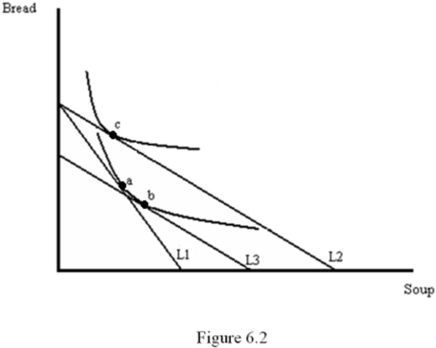
A) the price of soup has increased and soup is a Giffen good.
B) the price of soup has fallen and soup is a Giffen good.
C) the price of soup has fallen and soup is a normal good.
D) the price of soup has fallen and bread is a Giffen good.
Correct Answer:
Verified
Q30: For low wages,the leisure demand curve slopes
Q31: Which of the following statements about the
Q32: The effect of a compensated price change
Q33: If a good is _,the income effect
Q34: The income effect of a price change
Q36: A compensated increase in the price of
Q37: The substitution effect of a price change
Q38: If a good is normal,then the income
Q39: For low wages,the labor supply curve slopes
Q40: If leisure is drawn on the horizontal
Unlock this Answer For Free Now!
View this answer and more for free by performing one of the following actions

Scan the QR code to install the App and get 2 free unlocks

Unlock quizzes for free by uploading documents