Exhibit 17-1 The Lorenz Curve 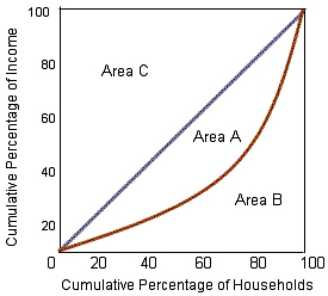 Refer to Exhibit 17-1.Which of the following represents the amount of income inequality?
A) Area A
B) Area B
C) Area C
D) Area (A + B)
Correct Answer:
Verified
Q32: The demand curve for human organs is
Q33: Evidence suggests that emergency care services are
Q34: Exhibit 17-1 The Lorenz Curve 
Q35: Currently,the supply curve for human organs is
Q36: HMOs seek to contain health care costs
Q38: Shortages prevail in the market for organ
Q39: The Lorenz curve represents:
A) the line of
Q40: Which of the following observations would be
Q41: An example of in-kind income is:
A) a
Q42: Which of the following best explains why
Unlock this Answer For Free Now!
View this answer and more for free by performing one of the following actions

Scan the QR code to install the App and get 2 free unlocks

Unlock quizzes for free by uploading documents