In the following graph, 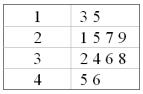
A) The median is 2.5.
B) The minimum value is 135.
C) The maximum value is 456.
D) The range is 33.
Correct Answer:
Verified
Q21: In a distribution, the second quartile corresponds
Q29: What statistics are needed to draw a
Q31: In the following set of data, what
Q32: A dot plot is best applied for
Q33: The following graph is a 
Q34: To locate the percentile for a given
Q37: A dot plot shows the
A) The general
Q38: If a student places in the 99th
Q39: A scatter diagram of sales versus production
Q42: A stem-and-leaf display includes the following row:
Unlock this Answer For Free Now!
View this answer and more for free by performing one of the following actions

Scan the QR code to install the App and get 2 free unlocks

Unlock quizzes for free by uploading documents