In the following graph, 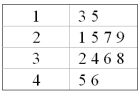
A) There are 16 observations.
B) There are four observations in the second class.
C) There are ten observations less than thirty.
D) There are ten observations greater than thirty.
Correct Answer:
Verified
Q11: A relationship between two nominal variables is
Q23: A stem-and-leaf display includes the following row:
Q24: The following graph is a 
Q30: A relationship between gender and preference for
Q31: In the following set of data, what
Q32: A dot plot is best applied for
Q34: Percentiles divide a distribution into _.
A)2 equal
Q37: The test scores for a class of
Q37: A dot plot can be used to
Q39: Quartiles divide a distribution into _.
A)2 equal
Unlock this Answer For Free Now!
View this answer and more for free by performing one of the following actions

Scan the QR code to install the App and get 2 free unlocks

Unlock quizzes for free by uploading documents