The following graph is a 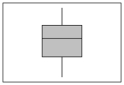
A) Dot plot
B) Stem-and-leaf display
C) Box plot
D) Contingency table
Correct Answer:
Verified
Q28: A box plot shows _.
A) The mean
Q41: In a scatter diagram,we describe the relationship
Q45: Outliers are clearly presented in a _.
A)
Q45: What is the value of the Pearson
Q47: A sample of experienced typists revealed that
Q47: In a contingency table,we describe the relationship
Q49: If the coefficient of skewness is equal
Q50: What does the interquartile range describe?
A) The
Q51: A large oil company is studying the
Q53: The following graph is ![]()
Unlock this Answer For Free Now!
View this answer and more for free by performing one of the following actions

Scan the QR code to install the App and get 2 free unlocks

Unlock quizzes for free by uploading documents