The following graph illustrates 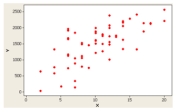
A) A positive or direct relationship.
B) A negative or inverse relationship.
C) No relationship.
D) A distribution for a single variable.
Correct Answer:
Verified
Q21: In a distribution, the second quartile corresponds
Q28: A box plot shows _.
A) The mean
Q29: What statistics are needed to draw a
Q37: A dot plot shows the
A) The general
Q39: A scatter diagram of sales versus production
Q42: A stem-and-leaf display includes the following row:
Q45: What is the value of the Pearson
Q45: Outliers are clearly presented in a _.
A)
Q47: In a contingency table,we describe the relationship
Q47: A sample of experienced typists revealed that
Unlock this Answer For Free Now!
View this answer and more for free by performing one of the following actions

Scan the QR code to install the App and get 2 free unlocks

Unlock quizzes for free by uploading documents