The diagram below shows the marginal cost of pollution abatement for two firms,Firm X and Firm Y. 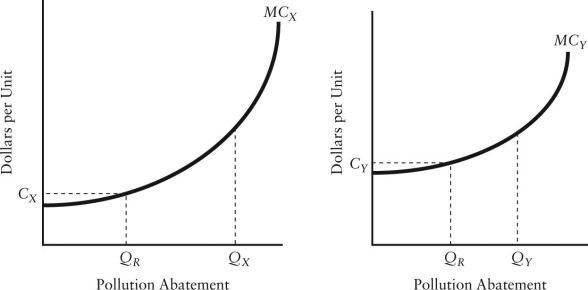 FIGURE 17-4
-Refer to Figure 17-4.Suppose Firms X and Y are each abating QR units of pollution.If Firm X then reduces pollution by one unit and Firm Y increases pollution by one unit,then
A) total pollution remains the same but the total cost of abatement falls.
B) total pollution remains the same but the total cost of abatement increases.
C) the total cost of abatement remains the same but pollution falls.
D) the total cost of abatement remains the same but pollution increases.
E) the total costs of abatement and the amount of pollution do not change.
Correct Answer:
Verified
Q69: The diagram below shows the marginal costs
Q70: The diagram below shows the marginal costs
Q71: Consider two firms,A and B,that must engage
Q72: Two firms,A and B,are legally required to
Q73: Which of the following environmental problems would
Q75: Automobile emissions standards are an example of
A)direct
Q76: Why are direct controls for reducing pollution
Q77: The diagram below shows the marginal cost
Q78: The table below shows the marginal costs
Q79: Direct controls for reducing pollution can be
Unlock this Answer For Free Now!
View this answer and more for free by performing one of the following actions

Scan the QR code to install the App and get 2 free unlocks

Unlock quizzes for free by uploading documents