The following graph is ________. 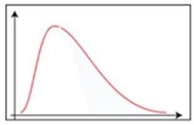
A) positively skewed
B) negatively skewed
C) symmetric
D) uniformly distributed
Correct Answer:
Verified
Q54: The following graph is a _.
Q55: Outliers are clearly presented in a _.
A)dot
Q56: In the following table, Q57: A contingency table would be used to Q58: What is the possible range of values Q59: A large oil company is studying the Q61: The 75th percentile is referred to as Q62: The 67th percentile is _. Q63: Which of the following is NOT a Q64: The eighth decile _.![]()
A)the value above
A)contains at least 70%
Unlock this Answer For Free Now!
View this answer and more for free by performing one of the following actions

Scan the QR code to install the App and get 2 free unlocks

Unlock quizzes for free by uploading documents