For a single seller, the figure below shows the relationship between the number of units produced and the opportunity cost of producing an additional unit of output. If the market consists of 50 identical sellers, how much would be supplied in the market at a price of $14 per unit? 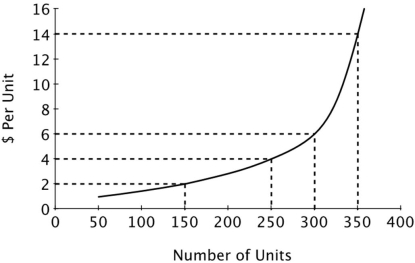
A) 350
B) 1,750
C) 17,500
D) 175,000
Correct Answer:
Verified
Q5: For a given seller, the figure below
Q6: John is trying to decide how
Q7: A seller's supply curve shows the seller's:
A)willingness
Q8: John is trying to decide how
Q9: John is trying to decide how
Q11: Your neighbors have offered to pay you
Q13: John is trying to decide how
Q14: John is trying to decide how
Q15: For a given seller, the figure below
Q20: Which of the following best explains why
Unlock this Answer For Free Now!
View this answer and more for free by performing one of the following actions

Scan the QR code to install the App and get 2 free unlocks

Unlock quizzes for free by uploading documents