Multiple Choice
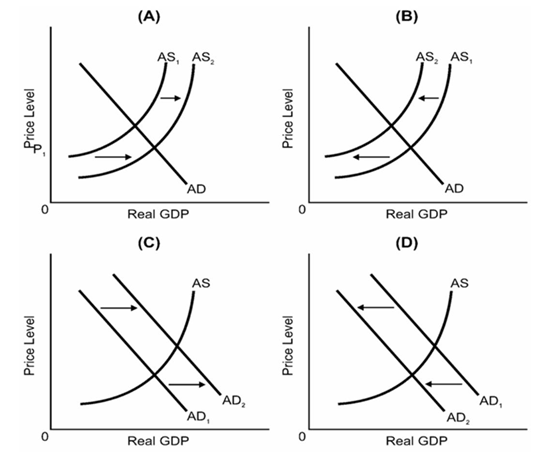
-Which of the above diagrams best portrays the effects of a decrease in the availability of key natural resources?
A) A
B) B
C) C
D) D
E) both A and B
Correct Answer:
Verified
Related Questions
Q52: If personal taxes were lowered and input
Q53: Q54: Q55: Q56: In which of the following sets of Q58: Q59: We would expect a decrease in personal Q60: We would expect an increase in input Q61: Q62: Unlock this Answer For Free Now! View this answer and more for free by performing one of the following actions Scan the QR code to install the App and get 2 free unlocks Unlock quizzes for free by uploading documents![]()
![]()
![]()
![]()
![]()
![]()

