Consider the following cost-volume-profit graph: 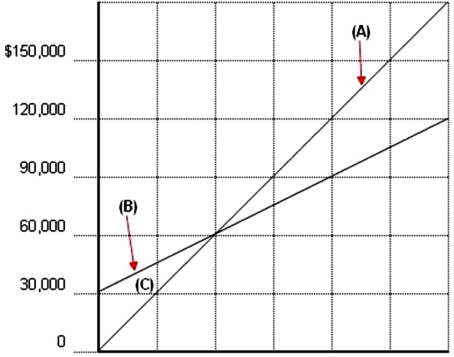 The area designated by the letter (C) represents which of the following?
A) Profit area
B) Loss area
C) Break-even area
D) Fixed cost area
Correct Answer:
Verified
Q22: The margin of safety ratio can be
Q23: How does the cost-volume-profit model accommodate non-linear
Q30: Consider the following cost-volume-profit graph: 
Q30: If a company experiences an increase in
Q31: Consider the following cost-volume-profit graph:
Q33: Columbus Industries makes a product that sells
Q35: A pricing strategy that sets the price
Q37: Consider the following cost-volume-profit graph:
Q39: Which of the following is not an
Q53: Burke Company has a break-even of $600,000
Unlock this Answer For Free Now!
View this answer and more for free by performing one of the following actions

Scan the QR code to install the App and get 2 free unlocks

Unlock quizzes for free by uploading documents