Multiple Choice
Exhibit 6.6
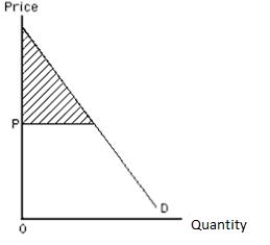
-Refer to Exhibit 6.6,which shows the market demand schedule for a good.When the price of the good is zero,the shaded and unshaded areas under the demand curve D represent _____
A) shortage.
B) the marginal utility of the good.
C) price floor.
D) consumer surplus.
E) the marginal valuation of the good.
Correct Answer:
Verified
Related Questions
Q126: Table 6.7 Q127: Elvis values the first gravy sandwich at Q128: Exhibit 6.6 Q129: Elvis values the first gravy sandwich at Unlock this Answer For Free Now! View this answer and more for free by performing one of the following actions Scan the QR code to install the App and get 2 free unlocks Unlock quizzes for free by uploading documents
![]()

