The table given below represents the payoff matrix of firms A and B,when they choose to produce either high output or low output.In each cell,the figure on the left indicates Firm B's payoffs and the figure on the right indicates Firm A's payoffs. 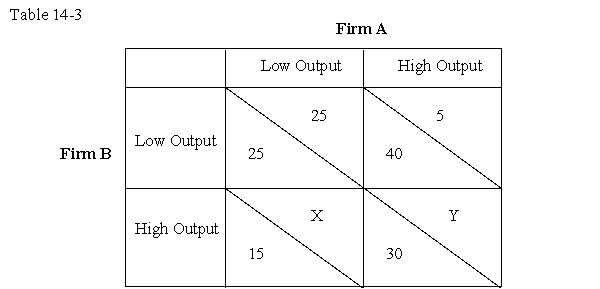
-If X = 10 and Y = 15,then which of the following conclusions can be drawn from the information given in Table 14-3?
A) The game has a Nash equilibrium and a dominant-strategy equilibrium.
B) The game has a Nash equilibrium but not a dominant-strategy equilibrium.
C) The game does not have a Nash equilibrium but has a dominant-strategy equilibrium.
D) The game has neither a Nash equilibrium nor a dominant-strategy equilibrium.
Correct Answer:
Verified
Q7: The three most common elements in game
Q9: The table given below represents the payoff
Q9: A representation of how each combination of
Q10: The table given below shows the payoffs
Q11: The table given below represents the payoff
Q12: The table given below describes the payoffs
Q14: The table given below represents the payoff
Q15: The table given below shows the payoffs
Q18: If a firm is better off with
Q18: The table given below represents the payoff
Unlock this Answer For Free Now!
View this answer and more for free by performing one of the following actions

Scan the QR code to install the App and get 2 free unlocks

Unlock quizzes for free by uploading documents