The figure given below shows the demand and supply of unskilled labor that determines the equilibrium wage rate in the labor market.The minimum wage rate at $5.15 is higher than the equilibrium wage rate at $4. 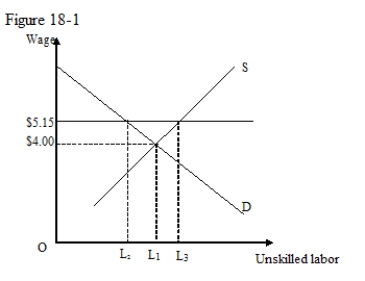
-Refer to Figure 18-1.Which of the following distances represents the disemployment effect of the minimum wage?
A) L1L3
B) L2L3
C) L2 L1
D) OL2
Correct Answer:
Verified
Q1: The minimum wage law is not an
Q4: The disemployment effect of a minimum wage
Q8: Which of the following is not a
Q9: Suppose the current wage of Type A
Q10: The cost of the minimum wage is
Q12: The figure given below shows the demand
Q13: A minimum wage mandated by the government
Q15: Minimum wage laws are promoted as the
Q19: Consider a labor market where the demand
Q20: The disemployment effect of the minimum wage
Unlock this Answer For Free Now!
View this answer and more for free by performing one of the following actions

Scan the QR code to install the App and get 2 free unlocks

Unlock quizzes for free by uploading documents