Multiple Choice
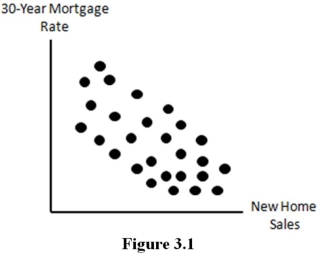
-The scatter diagram in figure suggests that ______ relationship likely exists between 30-year mortgage rates and new home sales.
A) a positive linear
B) a negative linear
C) a quadratic
D) no linear
Correct Answer:
Verified
Related Questions
Q1: Suppose that a data set contains 275
Q2: The standard deviation of a distribution provides
Q4: Suppose that a data set contains 275
Q5: An outlier is
A)a data point that falls
Unlock this Answer For Free Now!
View this answer and more for free by performing one of the following actions

Scan the QR code to install the App and get 2 free unlocks

Unlock quizzes for free by uploading documents