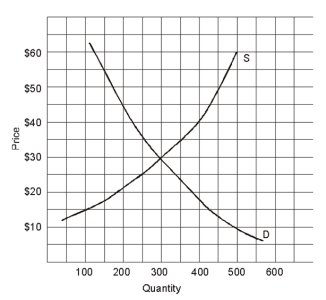
-In the graph shown above at a price of $38
A) there is a surplus.
B) there is a shortage.
C) quantity demanded is greater than quantity supplied.
D) there is a shortage and quantity demanded is greater than quantity supplied,but there is not a surplus.
E) there is a surplus and quantity demanded is greater than quantity supplied,but there is not a shortagE.
Correct Answer:
Verified
Q105: When the price is $2
A)quantity supplied is
Q131: Q139: Which situation below would represent a shortage Q142: As price falls,quantity supplied Q143: If the government imposes a maximum price Q146: Q153: When demand falls and supply stays the Q154: When supply falls and demand stays the Q156: When supply falls and demand stays the Q159: Unlock this Answer For Free Now! View this answer and more for free by performing one of the following actions Scan the QR code to install the App and get 2 free unlocks Unlock quizzes for free by uploading documents![]()
A)rises.
B)falls.
C)remains the same.

