A Procter and Gamble factory process fills boxes with detergent. Construct an appropriate set of control charts to monitor the process. Historical data for fill weight (in ounces) of eight samples is presented below. A sample size of six was used. 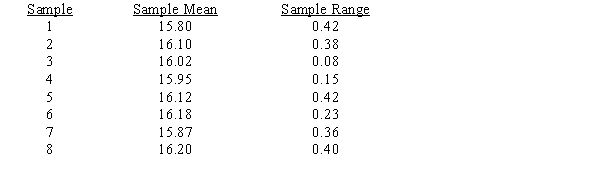
a.Compute the limits for both an R-chart and x-bar chart. Compare the sample results to the limits of the charts.
b.Briefly explain what the quality control charts tell you. What actions, if any, would you take?
Correct Answer:
Verified
LCLR = (0)(...
View Answer
Unlock this answer now
Get Access to more Verified Answers free of charge
Q62: A high-paced discount store in Los Angeles
Q69: Find the control limits for a c-chart
Q72: Flaws are counted on a standard steel
Q73: An operator has determined what her percent
Q75: Over several days, 25 samples of 100
Q76: A manufacturer inspected 40 circuit boards and
Q86: Discuss the difference between a continuous metric
Q88: A company is measuring the time it
Q102: What is the purpose of a process
Q107: A bottling machine fills soft drink bottles
Unlock this Answer For Free Now!
View this answer and more for free by performing one of the following actions

Scan the QR code to install the App and get 2 free unlocks

Unlock quizzes for free by uploading documents