Five samples were taken, with five observations each. The sample findings are listed below. The sample values represent service times in minutes. 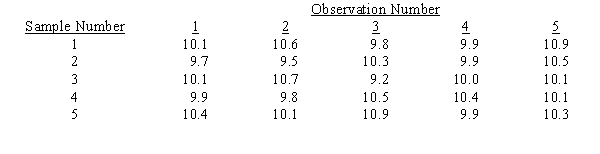
a.Determine the control limits for the R-chart.
b.Would you conclude the R-chart is in statistical control and proceed to develop the x-bar chart?
Correct Answer:
Verified
View Answer
Unlock this answer now
Get Access to more Verified Answers free of charge
Q62: A high-paced discount store in Los Angeles
Q73: An operator has determined what her percent
Q75: Over several days, 25 samples of 100
Q82: Jim is a quality control manager at
Q83: A company that manufactures arrows for sale
Q84: A company that makes handheld computers is
Q85: A steel company is interested in determining
Q89: A production process is sampled 24 times
Q102: What is the purpose of a process
Q107: A bottling machine fills soft drink bottles
Unlock this Answer For Free Now!
View this answer and more for free by performing one of the following actions

Scan the QR code to install the App and get 2 free unlocks

Unlock quizzes for free by uploading documents