Which of the following diagrams represents the cardinality pairs in a situation where a specific production run results in a specific finished good,and a specific finished good is produced periodically?
A) 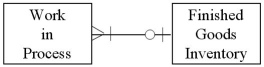
B) 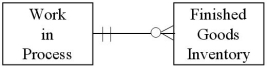
C) 
D) 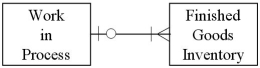
Correct Answer:
Verified
Q63: The relationship between the Recruiting event and
Q64: Identify the entity that stores most of
Q65: Which of the following diagrams represents the
Q66: Which of the following is not one
Q67: In a database created using an REA
Q69: In an REA diagram for the HR/Payroll
Q70: Which of the following accurately represents typical
Q71: Which of the following represents the cardinality
Q72: Describe the four main events of interest
Q73: In which entity would information about depreciation
Unlock this Answer For Free Now!
View this answer and more for free by performing one of the following actions

Scan the QR code to install the App and get 2 free unlocks

Unlock quizzes for free by uploading documents