The histograms show the cost of living,in dollars,for 32 U.S.cities.The histogram on the left shows the cost of living for the 32 cities using bins $10 wide,and the histogram on the right displays the same data using bins that are $6 wide.For which of the histograms would you most strenuously insist on using an IQR rather than a standard deviation to summarize spread? Explain. 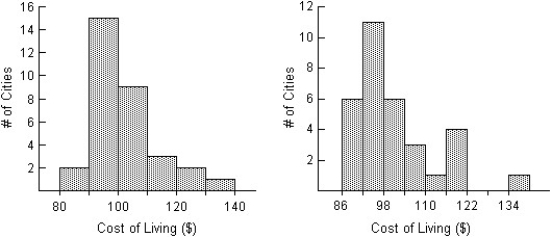
A) The histogram on the right is most nearly symmetric and shows no outliers.That makes it the best candidate for summarizing with an IQR.
B) The histogram on the left shows a low outlier.The standard deviation is sensitive to outliers,so we'd prefer to use the IQR for this one.
C) The histogram on the right shows a high outlier.The standard deviation is sensitive to outliers,so we'd prefer to use the IQR for this one.
D) The histogram on the left is most strongly skewed to the right.That makes it the best candidate for summarizing with an IQR.
E) The histogram on the left is most nearly symmetric and shows no outliers.That makes it the best candidate for summarizing with an IQR.
Correct Answer:
Verified
Q16: The histograms display the body fat percentages
Q17: The histogram shows the sizes (in acres)of
Q18: Office workers were asked how long it
Q19: The histogram shows the lengths of hospital
Q20: Here are summary statistics of the four
Q22: The annual incomes,in dollars,of several doctors are
Q23: A new business had the following monthly
Q24: The students in a math class took
Q25: The employees at Frank's Furniture earned the
Q26: The number of cars passing through a
Unlock this Answer For Free Now!
View this answer and more for free by performing one of the following actions

Scan the QR code to install the App and get 2 free unlocks

Unlock quizzes for free by uploading documents