The back-to-back dotplot shows the number of fatalities per year caused by tornadoes in a certain state for two periods: 1950-1974 and 1975-1999.Explain how you would summarize the centre and spread of each of the variables depicted in the dotplots. 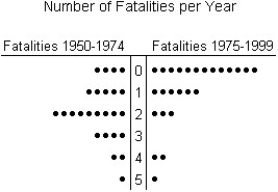
A) The distribution of the number of fatalities per year for the period 1950-1974 is unimodal and approximately symmetric.Therefore,we would be satified using the mean to summarize the centre and the standard deviation to summarize spread.For the period 1975-1999,the distribution of the number of fatalities per year is also unimodal,but skewed to the right.Therefore,we would prefer to use a median for centre and an IQR to summarize spread.
B) The distribution of the number of fatalities per year for the period 1950-1974 is unimodal,but skewed to the right.Therefore,we would prefer to use a median for centre and an IQR to summarize spread.For the period 1975-1999,the distribution is also unimodal and approximately symmetric.Therefore,we would be satisfied using the mean to summarize the centre and the standard deviation to summarize spread.
C) The distribution of the number of fatalities per year for the period 1950-1974 is bimodal.Therefore,we would prefer to use a median to summarize the centre and an IQR to summarize spread.For the period 1975-1999,the distribution of the number of fatalities per year is also bimodal,but skewed to the left.Therefore,we would prefer to use a mean for centre and an standard deviation to summarize spread.
D) The distribution of the number of fatalities per year for the period 1950-1974 is unimodal and approximately symmetric.Therefore,we would prefer to use the median to summarize the centre and the standard deviation to summarize spread.For the period 1975-1999,the distribution of the number of fatalities per year is also unimodal,but skewed to the right.Therefore,we would prefer to use the mean for centre and an IQR to summarize spread.
E) The distribution of the number of fatalities per year for the period 1950-1974 is unimodal but skewed to the right.Therefore,we would prefer to use a median to summarize the centre and and IQR to summarize spread.For the period 1975-1999,the distribution of the number of fatalities per year is also unimodal and skewed to the right.Therefore,we would prefer to use a median for centre and an IQR to summarize spread.
Correct Answer:
Verified
Q25: The employees at Frank's Furniture earned the
Q26: The number of cars passing through a
Q27: The local Tupperware dealers earned the following
Q28: Here are the number of hours that
Q31: The precipitation,in millimetres,for August is given for
Q33: Here are the amounts,in dollars,spent by six
Q34: A substitute teacher traveled the following distances,in
Q35: Here are the weights,in grams,of several snack
Q41: Here are the number of baseball games
Q46: A small company employs a supervisor at
Unlock this Answer For Free Now!
View this answer and more for free by performing one of the following actions

Scan the QR code to install the App and get 2 free unlocks

Unlock quizzes for free by uploading documents