The mathematics department at a Canadian university collected data for the number of students enrolled in 40 math courses over the course of one year.The following stem-and-leaf display shows the total number of students enrolled in each class. 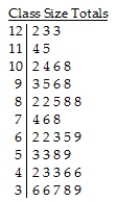
Key:
10 | 6 = 106 students
A) The distribution of the number of students enrolled in each of 40 math courses is skewed to the left,with a typical class size of 89 students.The smallest class size was 36 and the largest was 123.
B) The distribution of the number of students enrolled in each of 40 math courses is unimodal and symmetric.The smallest class size was 36 and the largest was 123.The centre of the distribution was around 75 students.
C) The distribution of the number of students enrolled in each of 40 math courses is nearly uniform.The smallest class size was 36 and the largest was 123.The centre of the distribution was around 89 students.
D) The distribution of the number of students enrolled in each of 40 math courses is nearly uniform.The smallest class size was 36 and the largest was 123.The centre of the distribution was around 75 students.
E) The distribution of the number of students enrolled in each of 40 math courses is skewed to the right,with a typical class size of 69 students.The smallest class size was 36 and the largest was 123.
Correct Answer:
Verified
Q59: Here are the commutes (in kilometres)for a
Q60: The weights (in kilograms)of 27 dogs are
Q61: The following stem-and-leaf display shows the number
Q62: Ontario wanted to find the typical size
Q63: The number of days off that 30
Q65: In a college health course,65 students participated
Q66: The diastolic blood pressures,in mm Hg,for a
Q67: The data below represent the midterm grades
Q68: In a survey,26 voters were asked their
Q69: A dotplot of the number of tornadoes
Unlock this Answer For Free Now!
View this answer and more for free by performing one of the following actions

Scan the QR code to install the App and get 2 free unlocks

Unlock quizzes for free by uploading documents