Students were asked to make a histogram of the number of corn snakes collected in Will County,Illinois from 1985 to 2006.They were given the data in the form of a stem-and-leaf display shown below: 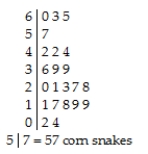
One student submitted the following display: 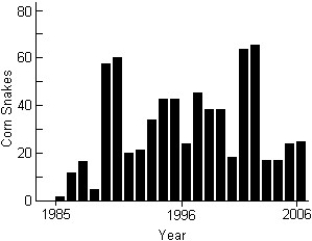
a)Comment on this graph.
b)Create your own histogram of the data.
Correct Answer:
Verified
View Answer
Unlock this answer now
Get Access to more Verified Answers free of charge
Q7: Which class had the largest standard deviation?
A)Class
Q80: In a survey,20 people were asked how
Q81: How would you describe the shape of
Q82: Three statistics classes (50 students each)took the
Q84: A sewing supply company has a database
Q86: For class 2,compare the mean and the
Q86: A clerk entering salary data into a
Q87: A weight-loss company used the following histogram
Q87: During student-teacher negotiations at a certain high
Q90: Three statistics classes (50 students each)took the
Unlock this Answer For Free Now!
View this answer and more for free by performing one of the following actions

Scan the QR code to install the App and get 2 free unlocks

Unlock quizzes for free by uploading documents