Figure 17.9
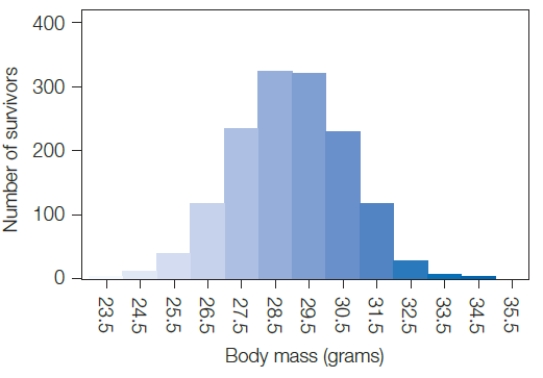
-The graph above shows the survival of sociable weavers as a function of body mass.Sociable weaver body mass seems to be an example of ____.
A) directional selection
B) stabilizing selection
C) sexual selection
D) disruptive selection
E) artificial selection
Correct Answer:
Verified
Q11: What is the term for a group
Q12: Emergence of a new species is known
Q13: Which individuals will be LEAST favored when
Q14: The Hardy-Weinberg law is useful for
A)
Q15: If the frequency of a recessive gene
Q17: All of the following are examples of
Q18: Male mallard ducks have had emerald green
Unlock this Answer For Free Now!
View this answer and more for free by performing one of the following actions

Scan the QR code to install the App and get 2 free unlocks

Unlock quizzes for free by uploading documents