Multiple Choice
The following graph is a: 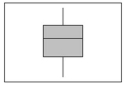
A) Dot plot
B) Stem-and-leaf display
C) Box plot
D) Contingency table
Correct Answer:
Verified
Related Questions
Q26: In a stem-and-leaf display,the leaf represents a
Q27: A dot plot is best applied for
Q28: A box plot shows _.
A) The mean
Q29: The following graph is a _.
Q29: What statistics are needed to draw a
Q30: In the following set of data:
Q33: A dot plot is best applied when
Q37: The test scores for a class of
Q37: A dot plot can be used to
Q39: Quartiles divide a distribution into _.
A)2 equal
Unlock this Answer For Free Now!
View this answer and more for free by performing one of the following actions

Scan the QR code to install the App and get 2 free unlocks

Unlock quizzes for free by uploading documents