The following table is a: 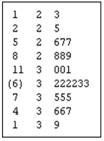
A) Dot plot
B) Stem-and-leaf display
C) Box plot
D) Contingency table
Correct Answer:
Verified
Q34: Percentiles divide a distribution into _.
A)2 equal
Q37: A dot plot can be used to
Q38: If a student places in the 99th
Q39: Quartiles divide a distribution into _.
A)2 equal
Q40: In a stem-and-leaf display,the leaf represents the
Q42: A stem-and-leaf display includes the following row:
Q44: The following graph is a _.
Q45: Outliers are clearly presented in a _.
A)
Q46: In the following table, Q58: What is the possible range of values![]()
Unlock this Answer For Free Now!
View this answer and more for free by performing one of the following actions

Scan the QR code to install the App and get 2 free unlocks

Unlock quizzes for free by uploading documents