For each of the accompanying scatterplots for several pairs of variables, indicate whether you expect a positive or negative correlation coefficient between the two variables, and the likely magnitude of it (you can use a small range).
(a) 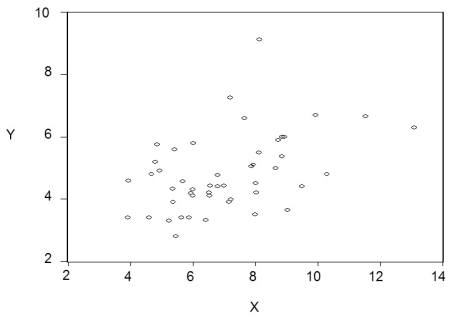 (b)
(b) 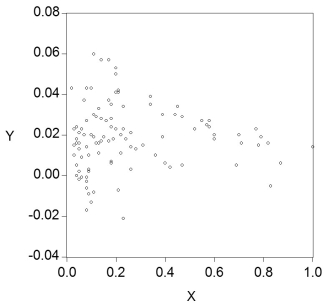 (c)
(c) 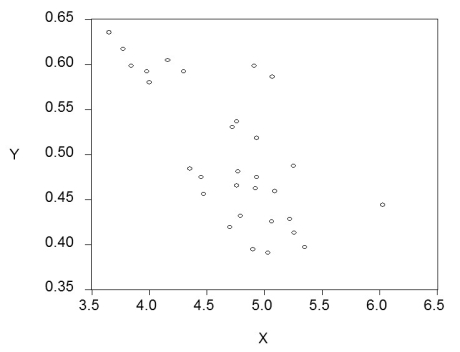 (d)
(d) 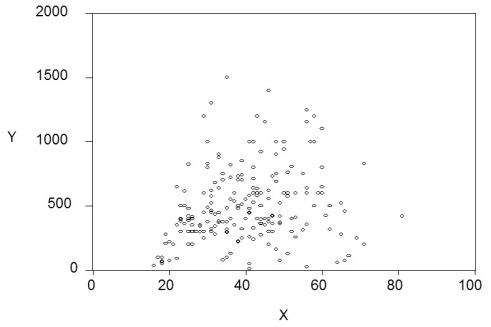
Correct Answer:
Verified
View Answer
Unlock this answer now
Get Access to more Verified Answers free of charge
Q53: The accompanying table lists the height
Q54: IQs of individuals are normally distributed
Q55: You have collected weekly earnings and
Q56: (Requires calculus.)Let Y be a Bernoulli
Q57: Let Y be a Bernoulli random
Q59: During the last few days before
Q60: When you perform hypothesis tests, you are
Q61: Consider two estimators: one which is biased
Q62: At the Stock and Watson (http://www.pearsonhighered.com/stock_watson)website go
Q63: At the Stock and Watson (http://www.pearsonhighered.com/stock_watson)website go
Unlock this Answer For Free Now!
View this answer and more for free by performing one of the following actions

Scan the QR code to install the App and get 2 free unlocks

Unlock quizzes for free by uploading documents