Consider the regression output from the following unrestricted model:
Unrestricted model:
Dependent Variable: TESTSCR
Method: Least Squares
Date: 07/31/06 Time: 17:35
Sample: 1 420
Included observations: 420 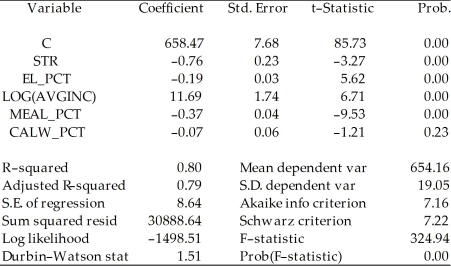 To test for the null hypothesis that neither coefficient on the percent eligible for subsidized lunch nor the coefficient on the percent on public income assistance is statistically significant, you have your statistical package plot the confidence set. Interpret the graph below and explain what it tells you about the null hypothesis.
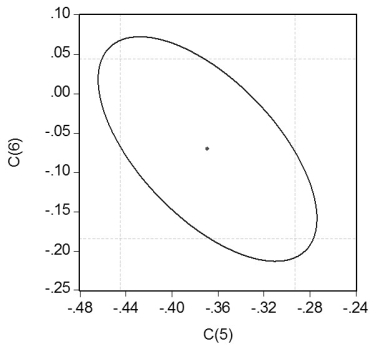
Correct Answer:
Verified
View Answer
Unlock this answer now
Get Access to more Verified Answers free of charge
Q52: Using the 420 observations of the
Q53: Females, on average, are shorter and
Q54: Consider the following two models to explain
Q55: Consider the regression model Yi =
Q56: Consider the following regression output for an
Q58: Adding the Percent of English Speakers (PctEL)to
Q59: Your textbook has emphasized that testing two
Q60: Give an intuitive explanation for 
Q61: Analyzing a regression using data from
Q62: Using the California School data set
Unlock this Answer For Free Now!
View this answer and more for free by performing one of the following actions

Scan the QR code to install the App and get 2 free unlocks

Unlock quizzes for free by uploading documents