Sports economics typically looks at winning percentages of sports teams as one of various outputs, and estimates production functions by analyzing the relationship between the winning percentage and inputs. In Major League Baseball (MLB), the determinants of winning are quality pitching and batting. All 30 MLB teams for the 1999 season. Pitching quality is approximated by "Team Earned Run Average" (ERA), and hitting quality by "On Base Plus Slugging Percentage" (OPS).
Summary of the Distribution of Winning Percentage, On Base Plus Slugging Percentage,
and Team Earned Run Average for MLB in 1999 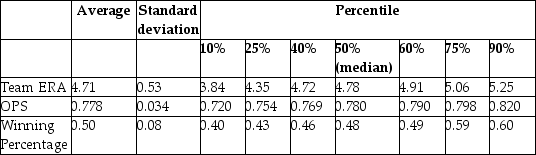 Your regression output is:
(a)Interpret the regression. Are the results statistically significant and important?
(b)There are two leagues in MLB, the American League (AL)and the National League (NL). One major difference is that the pitcher in the AL does not have to bat. Instead there is a "designated hitter" in the hitting line-up. You are concerned that, as a result, there is a different effect of pitching and hitting in the AL from the NL. To test this hypothesis, you allow the AL regression to have a different intercept and different slopes from the NL regression. You therefore create a binary variable for the American League (DAL)and estimate the following specification:
What is the regression for winning percentage in the AL and NL? Next, calculate the t-statistics and say something about the statistical significance of the AL variables. Since you have allowed all slopes and the intercept to vary between the two leagues, what would the results imply if all coefficients involving DAL were statistically significant?
(c)You remember that sequentially testing the significance of slope coefficients is not the same as testing for their significance simultaneously. Hence you ask your regression package to calculate the F-statistic that all three coefficients involving the binary variable for the AL are zero. Your regression package gives a value of 0.35. Looking at the critical value from you F-table, can you reject the null hypothesis at the 1% level? Should you worry about the small sample size?
Correct Answer:
Verified
View Answer
Unlock this answer now
Get Access to more Verified Answers free of charge
Q16: A nonlinear function
A)makes little sense, because variables
Q17: Including an interaction term between two
Q18: You have estimated the following equation:
Q19: The binary variable interaction regression
A)can only be
Q20: For the polynomial regression model,
A)you need new
Q22: In the model ln(Yi)= ?0 +
Q23: Earnings functions attempt to find the
Q24: In the log-log model, the slope
Q25: In the regression model Yi = β0
Q26: In the model Yi = ?0
Unlock this Answer For Free Now!
View this answer and more for free by performing one of the following actions

Scan the QR code to install the App and get 2 free unlocks

Unlock quizzes for free by uploading documents