Refer to the diagram,which shows three demand curves for coffee.Which of the following would cause the change in the demand for coffee illustrated by the shift from D1 to D2? 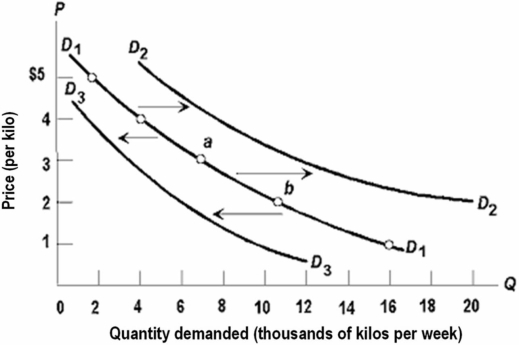
A) a decrease in the price of tea
B) an increase in consumer incomes
C) an increase in the price of sugar
D) a technological improvement in the production of coffee
Correct Answer:
Verified
Q35: The table below shows the market demand
Q37: The table below shows the market demand
Q41: By an "increase in demand" we mean:
A)that
Q43: An inferior good is:
A)one whose demand curve
Q46: If consumers are willing to pay a
Q49: A shift to the right in the
Q55: An inferior good is one:
A)that doesn't work.
B)that
Q56: In constructing a stable demand curve for
Q57: If product Y is an inferior good,
Q72: For most commodities, purchases tend to rise
Unlock this Answer For Free Now!
View this answer and more for free by performing one of the following actions

Scan the QR code to install the App and get 2 free unlocks

Unlock quizzes for free by uploading documents