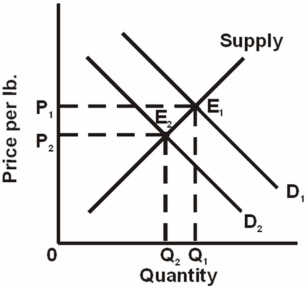
-Refer to the above graph,which shows the market for chicken where D1 and D2 represent different demand curves.A change from E1 to E2 is most likely to result from:
A) an increase in expectations of higher future prices for chicken.
B) an increase in the cost of chicken feed to produce chickens.
C) a decrease in the price of beef products.
D) an increase in consumer incomes.
Correct Answer:
Verified
Q41: If products C and D are close
Q74: Q81: The law of supply indicates that: Q87: People demand more of product X when Q88: If two goods are close substitutes: Q90: Other things equal, which of the following Q94: Which are not generally considered to be Q95: Which of the following would not shift Q100: The demand curve for a product might Q109: A market supply schedule for a product![]()
A) producers
A)consumers will
Unlock this Answer For Free Now!
View this answer and more for free by performing one of the following actions

Scan the QR code to install the App and get 2 free unlocks

Unlock quizzes for free by uploading documents