Multiple Choice
Refer to the diagram below for the market for corn.The equilibrium price and quantity in this market are: 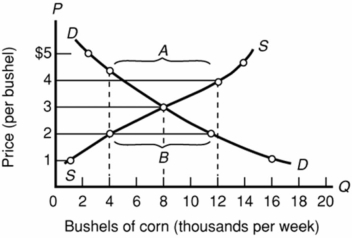
A) $4 and 10,000 bushels.
B) $3 and 8,000 bushels.
C) $2 and 4,000 bushels.
D) $2 and 11,000 bushels.
Correct Answer:
Verified
Related Questions
Q102: A surplus of a product will arise
Q105: If price is above the equilibrium level,
Q126: Q127: Refer to the diagram.The equilibrium price and Q130: A market is in equilibrium:![]()
A) when there
Unlock this Answer For Free Now!
View this answer and more for free by performing one of the following actions

Scan the QR code to install the App and get 2 free unlocks

Unlock quizzes for free by uploading documents