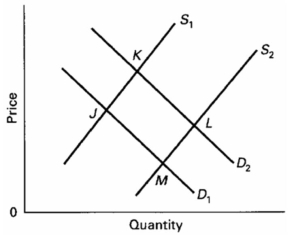
-Refer to the above diagram,in which S1 and D1 represent the original supply and demand curves and S2 and D2 the new curves.In this market the indicated shift in supply may have been caused by:
A) an increase in the wages paid to workers producing this good.
B) the development of more efficient machinery for producing this commodity.
C) this product becoming less fashionable.
D) an increase in consumer incomes.
Correct Answer:
Verified
Q104: Productive efficiency refers to
A) the use of
Q171: You are asked to determine,other things equal,the
Q178: Q182: To realize "full production" a society must Q183: Assuming an economy has fixed quantities of Q189: When an economy achieves both allocative and Q195: A news story states that "Videotapes lose Q196: In the corn market, demand often exceeds Q197: A headline reads "Gasoline Prices Are Higher." Q198: An "increase in efficiency" suggests that an![]()
Unlock this Answer For Free Now!
View this answer and more for free by performing one of the following actions

Scan the QR code to install the App and get 2 free unlocks

Unlock quizzes for free by uploading documents