Multiple Choice
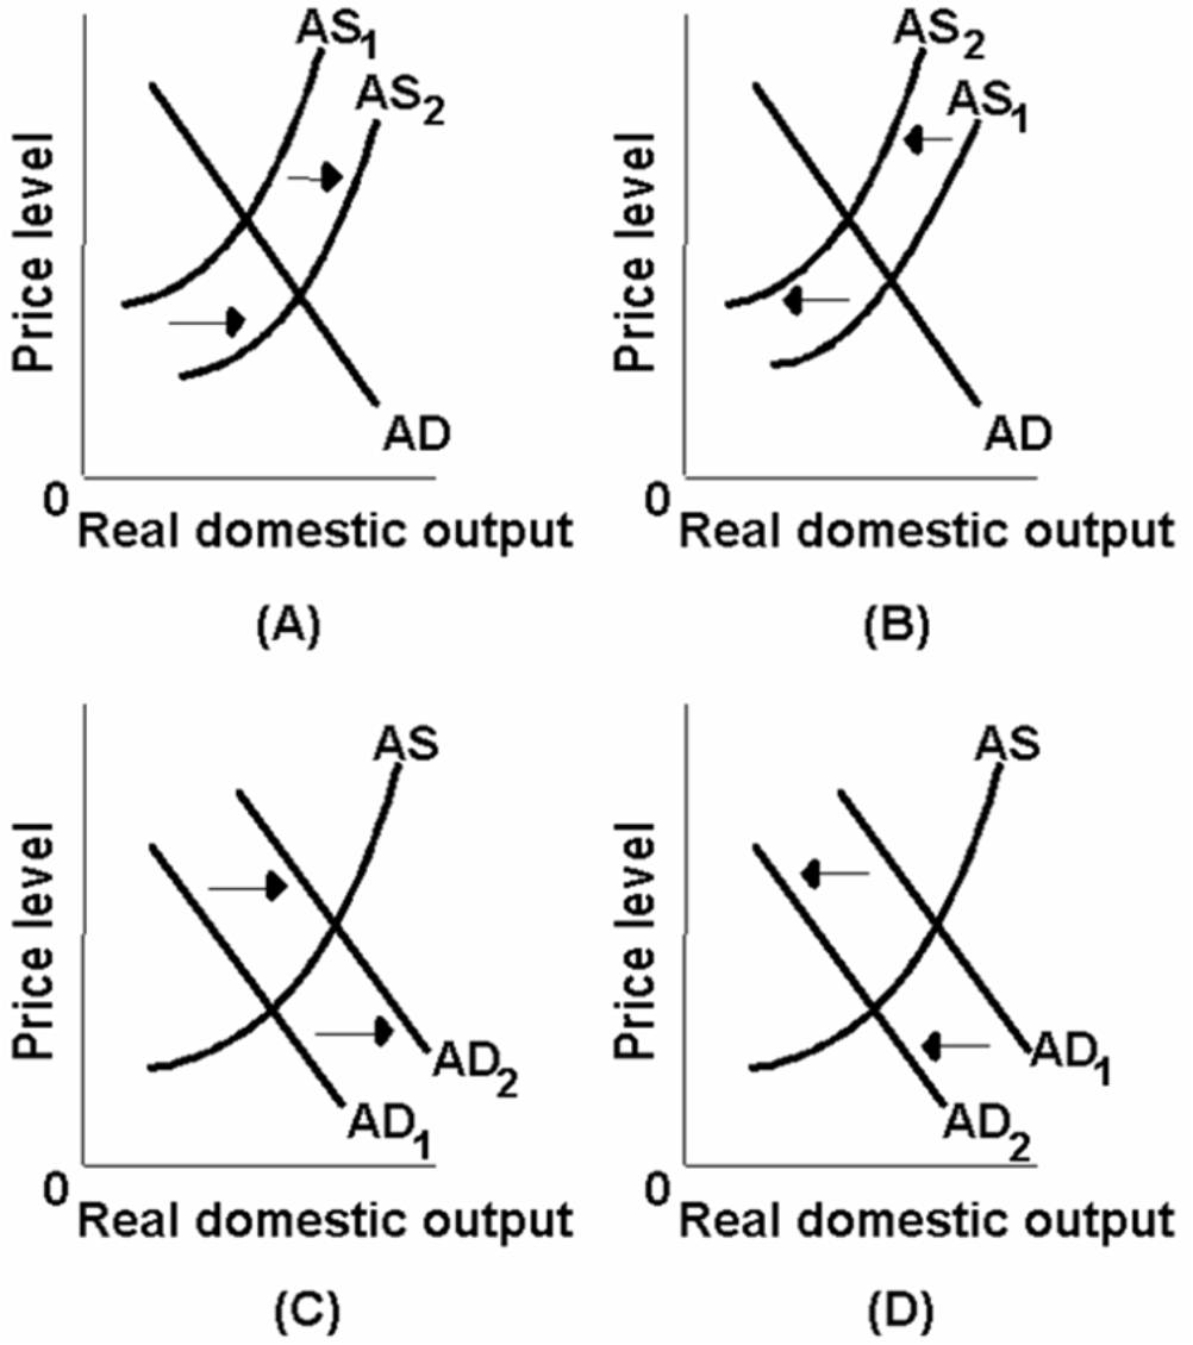
-Which of the above diagrams best portrays the effects of a dramatic increase in energy prices?
A) A
B) B
C) C
D) D
Correct Answer:
Verified
Related Questions
Q112: Q114: The following list of items are related Q116: The following aggregate demand and supply schedules Q117: If personal taxes were decreased and input Q118: Refer to the diagram below.Other things equal,a Unlock this Answer For Free Now! View this answer and more for free by performing one of the following actions Scan the QR code to install the App and get 2 free unlocks Unlock quizzes for free by uploading documents![]()

