Refer to the diagram below.A shift in the aggregate demand curve from AD1 to AD0 might be caused by a(n) : 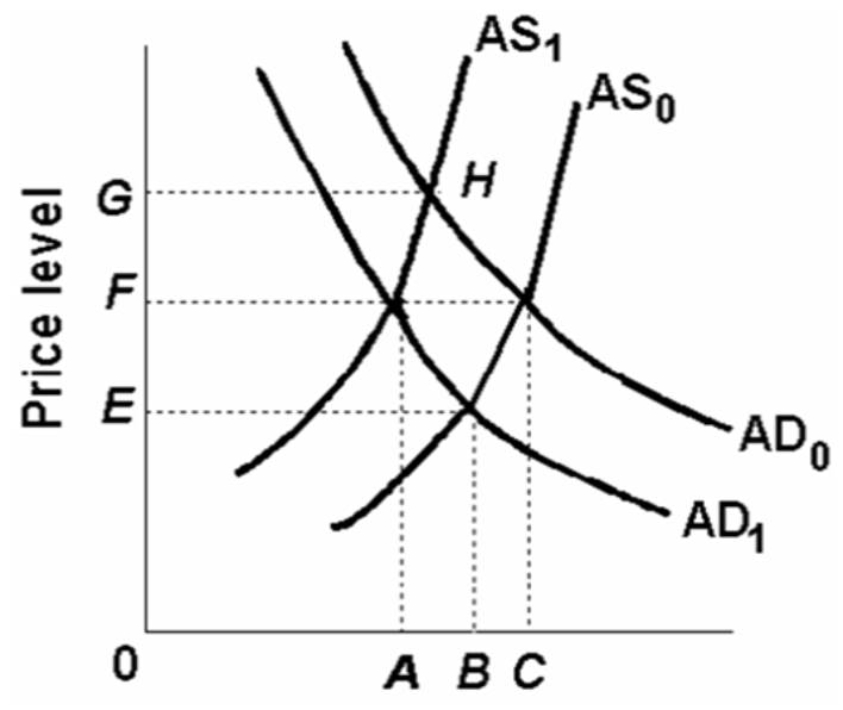
A) decrease in aggregate supply.
B) decrease in the amount of output supplied.
C) increase in investment spending.
D) decrease in net export spending.
Correct Answer:
Verified
Q123: Q129: Refer to the diagram below.Suppose that aggregate Q130: Q132: Q133: The following aggregate demand and supply schedules Q141: Menu costs will: Q148: Cost-push inflation arises from: Q155: Cost-push inflation occurs because of a: Q156: Collective bargaining agreements that prohibit wage cuts Q184: Wage contracts, efficiency wages, and the minimum Unlock this Answer For Free Now! View this answer and more for free by performing one of the following actions Scan the QR code to install the App and get 2 free unlocks Unlock quizzes for free by uploading documents![]()
![]()
![]()
A)increase the amount of training
A)a decrease in aggregate
A)rightward shift

