Figure 2.2
The histogram below represents scores achieved by 200 job applicants on a personality profile. 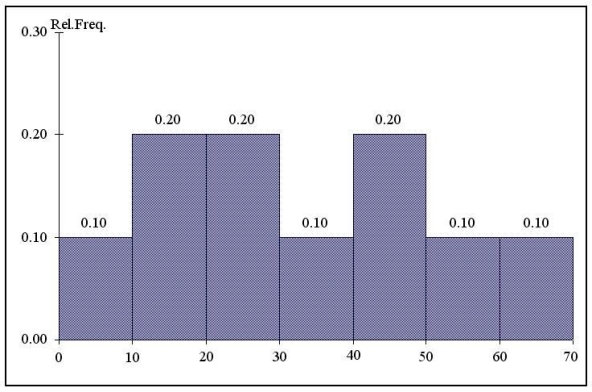
-Referring to the histogram from Figure 2.2,_________% of the job applicants scored between 10 and 20.
Correct Answer:
Verified
Q30: The width of each bar in a
Q61: Data on 1,500 students' weight were collected
Q62: When constructing charts,the following is plotted at
Q64: Data on the number of part-time hours
Q65: Figure 2.1
Every second semester, the School of
Q67: When polygons or histograms are constructed,which axis
Q69: When constructing polygons or histograms,the horizontal axis
Q104: An ogive is a cumulative percentage polygon.
Q120: A good choice for the number of
Q134: To determine the width of class interval,
Unlock this Answer For Free Now!
View this answer and more for free by performing one of the following actions

Scan the QR code to install the App and get 2 free unlocks

Unlock quizzes for free by uploading documents