Figure 2.2
The histogram below represents scores achieved by 200 job applicants on a personality profile. 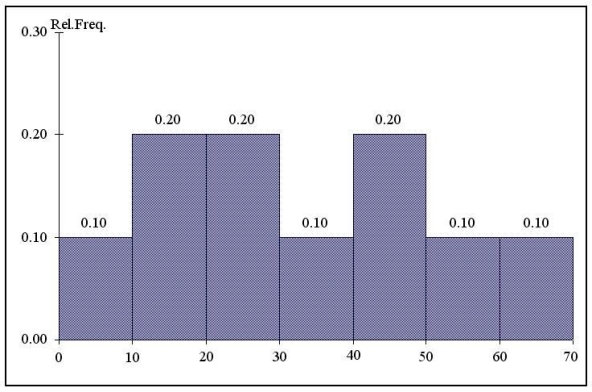
-Referring to the histogram from Figure 2.2,_________ %t of the job applicants scored below 50.
Correct Answer:
Verified
Q73: Figure 2.2
The histogram below represents scores achieved
Q75: Facebook collected information on the age of
Q79: In general,a frequency distribution should have at
Q80: Figure 2.1
Every second semester, the School of
Q81: Figure 2.2
The histogram below represents scores achieved
Q82: Instruction 2.6
The frequency distribution below represents
Q83: In constructing a polygon,each class grouping is
Q116: If you wish to construct a graph
Q121: A polygon can be constructed from a
Q134: The percentage polygon is formed by having
Unlock this Answer For Free Now!
View this answer and more for free by performing one of the following actions

Scan the QR code to install the App and get 2 free unlocks

Unlock quizzes for free by uploading documents